Performance
- 26 Apr 2024
- 8 Minutes to read
- Contributors


- Print
- DarkLight
Performance
- Updated on 26 Apr 2024
- 8 Minutes to read
- Contributors
- Print
- DarkLight
Article summary
Did you find this summary helpful?
Thank you for your feedback!
Dashboard
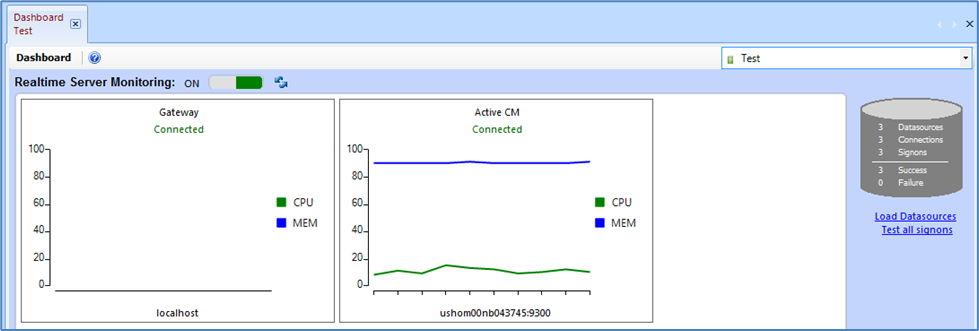
The Dashboard provides fast, at-a-glance health information related to an IBM Cognos environment. Users can get real-time information on: server availability, CPU usage, and memory consumption across the infrastructure. In addition to infrastructure information, there is specific Cognos BI information such as: which active users are currently in the environment, running and scheduled tasks, status of the Active Content Manager, and datasource validation. This combination of information gives administrators a truly holistic view into the health and performance of the IBM Cognos environment.
Server Topology
Server Topology provides users with real-time, metric information on servers within an IBM Cognos environment. Users will be able to view CPU utilization and Memory consumption.
Prerequisite: In order to use the real-time monitoring features, the BSP Software Performance Agent must be installed on all servers needing to be monitored.
Setting up the Performance Agent: If no CPU Data is coming through click the link for instructions on how to setup the Performance Agent. Follow the directions on the pop-up to install in the webapps or cgi-bin directory.
NOTE: Use the Machine.ashx when running Cognos with IIS. If running apache tomcat use the MMPerfAgent.war file. Apache Webserver is not currently supported.
Datasources

View the total number of datasources, connections, and sign-ons associated with the current IBM Cognos environment. Also, view and test the validation status of all datasource sign-ons with one click.
Active Users
View all active users currently logged in to the IBM Cognos environment. Administrators will be able to view:
Username
Current portal location (i.e.: Public Folders, My Folders, Report Studio, etc)
Time when the user logged in
Integrated Control SuiteTM, an BSP Software product, must be installed to view and send messages to the currently logged in users.

MetaManagerTM will leverage the broadcast messaging features of the Integrated Control SuiteTM if it is installed in the IBM Cognos environment. This will allow administrators to send a message to all active users currently logged in to the environment.
Activities

Activities will display all upcoming and currently running activities in the IBM Cognos environment. The information available to users will be:
Activity Name
Activity Type
Status
Start time of activity
Services
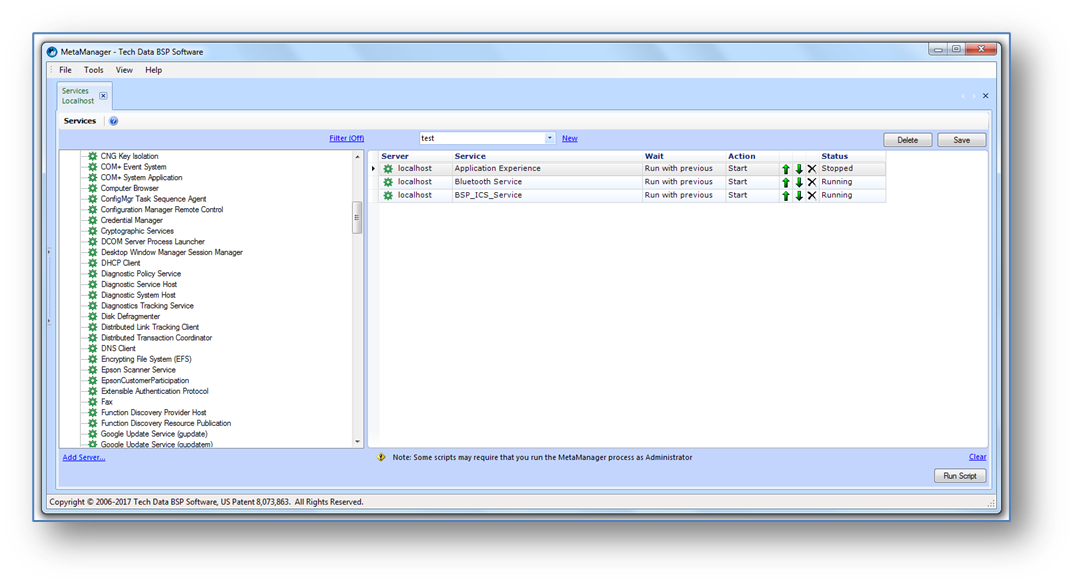
The Services module leverages MetaManagerTM’s established API to automate and script the management of these services. From a single console, administrators can stop, start, and restart services in a single environment or across multiple environments. In addition, the services can be executed in a specific order and wait in the event that some services need to start before others.
MetaManagerTM Services
Remote Severs
This will display the list of available severs the user is able to manage. Servers must be added manually. To add a server to manage, click the “Add Server…” button. Fill out the Server name and login information to load that particular server. Multiple Servers can be set up.
Once a server is added, users will be able to view a list of services running on the server by expanding the node next to the sever name.
Filter (On/Off) – With the Filter (On) selected only the Cognos Services will be displayed. With the Filter (Off) selected all services from that server will be displayed.
Save – Type a script name into the dropdown, drag and drop services into the grid area and select Save to save the script for future use.
Clear / New – Will clear the grid area of all services.
Drag-and-drop selected services to the canvas area on the right to manage those services. Users will have the ability to manage three properties of a service:
Action: Start or stop
Wait: Run with previous service or wait for previous service
Order: the order in which the services will be stopped or started
After services have been selected and the start or stop properties have been assigned the script can be executed by clicking the “Run Script” button.
NOTE: Some scripts may require that you run the MetaManagerTM process as an Administrator
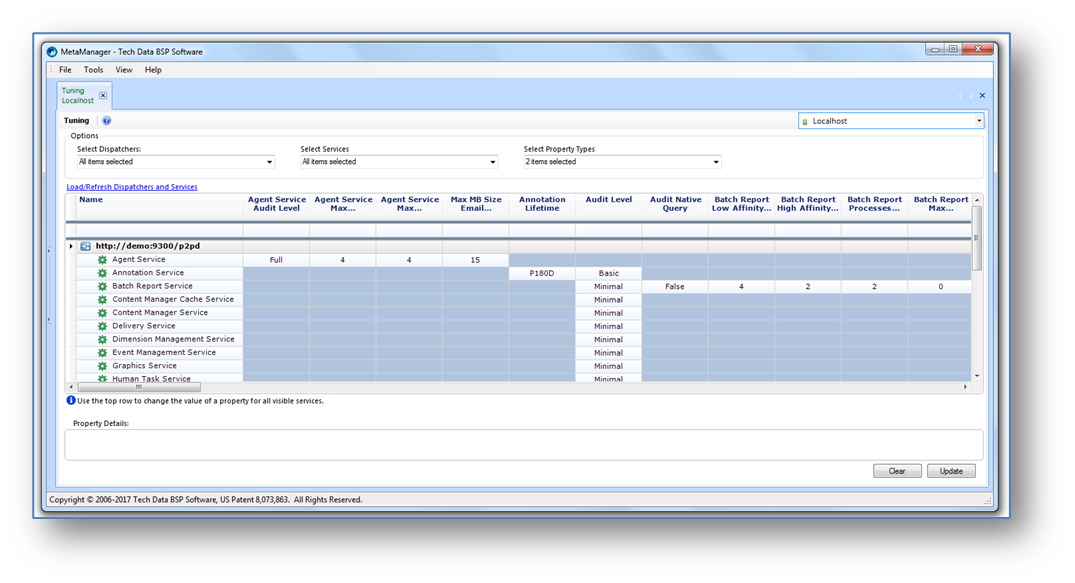
Tuning
The Tuning module allows administrators to display all, or some, IBM Cognos Administration settings across all dispatchers simultaneously and in spreadsheet form. This provides administrators the ability to apply settings in bulk to ensure they are consistent across all dispatchers.
The grid allows users to view and edit IBM Cognos administration settings on dispatchers. Clicking on any cell will enable a user to adjust the property’s value.
MetaManagerTM Tuning
The template row (Top Row of the Module) provides users with a way to cascade properties across multiple services and dispatchers. By filling a property field with a value and clicking Enter, the value is then applied to all services that have that property associated with it.
The filter drop-down selections provide users the ability to only display properties, dispatchers, or services they want to view. There are three specific ways the grid can be filtered:
Select Dispatchers: select all or some of the dispatchers in the environment.
Select Services: select all or some of the available Cognos services.
Select Property Type: select a specific property type to display.
The Property Details will give the definition of the property that is highlighted in the grid.
Load
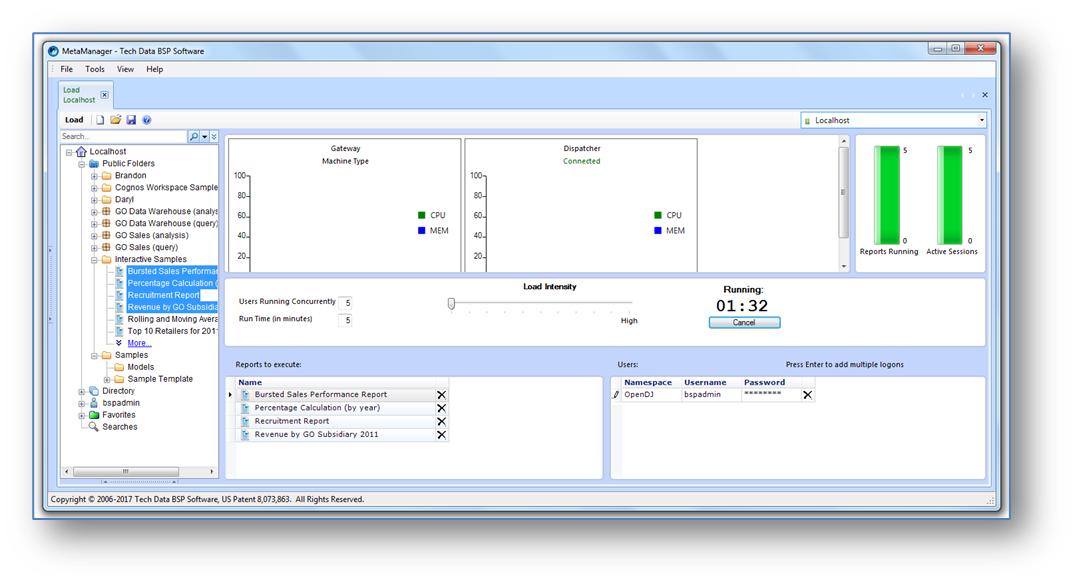
The Load module provides administrators with the ability to generate load against an environment in order to see the performance impact, the changes had on the environment.
MetaManagerTM Load
Reports to Execute: – Using the portal tree users can select reports to execute during the test.
Users: – Users can then define account(s) that will execute the reports by entering the following account information. Multiple accounts can be added for additional load.
Options: – The test options provide users the ability to appropriately scale the test.
Users Running Concurrently – Select the number of users to run concurrently.
Run Time (in minutes) – Select the number of minutes to run the load.
Load Intensity – Use the slider to increase or lower the intensity of the load.
Once all of the objects, users, and test options have been configured, users can click “Run” to execute the test.
Graphs displaying CPU utilization and memory consumption for each dispatcher will be displayed while the test is running.
Bar graphs displaying total number of running report and total active sessions will provide insight in to how much activity is being generated.
Validate
The Validation module provides fast insight into a variety of activity within an IBM Cognos environment including detailed audit information on reports, jobs, user logons, and datasources. This information can be used to troubleshoot acute problems within the environment, or as a health check to make sure everything is functioning as expected.
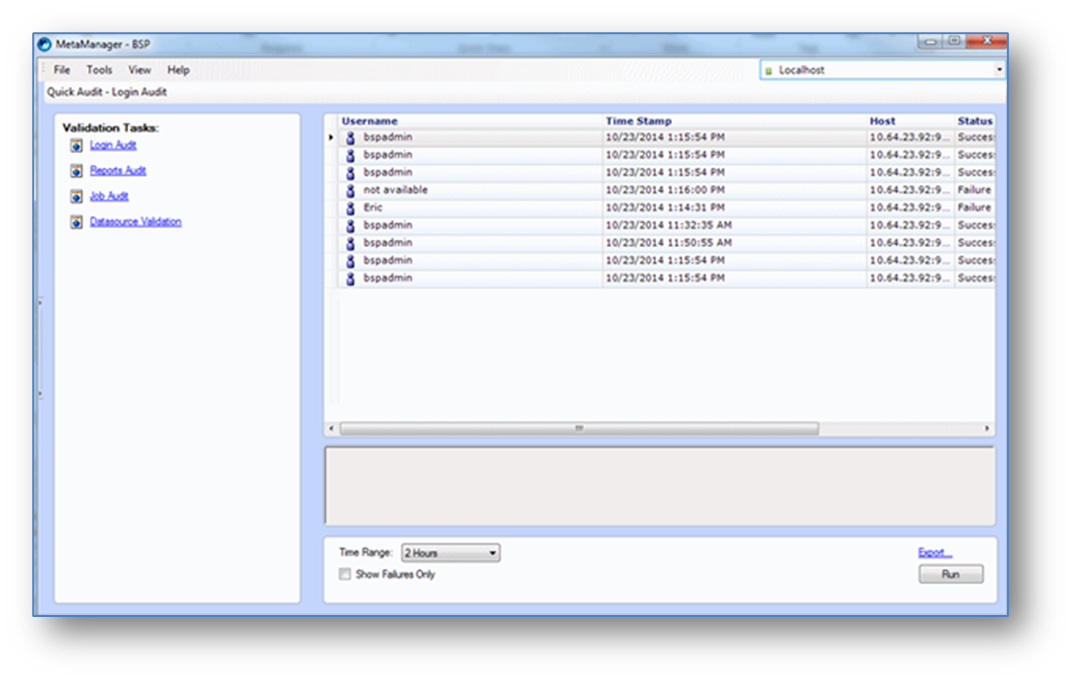
MetaManagerTM Validate
Select one of the four validation/audit links to get started. Click “Run” to execute the task.
Logon Audit
Report Audit
Job Audit
Datasource Validation
Options:
Time Range – Allows the user to select a specified amount of time to return the results. Show Failures Only – By selecting this checkbox only failed logons, reports, jobs will display. Export – Allows the user to export the data in the grid to an Excel file.
The Details pane will display additional information beyond what is displayed in the grid view. By highlighting an event in the grid, the Details pane will show this information.
Monitoring
The Monitoring module builds on the Performance Dashboard. With Monitoring users have the ability to monitor the Cognos Gateway, Dispatcher, and the Active Content Manager, and to be alerted to any change in status, such as a Gateway or Dispatcher failure.

On the Configuration tab, you can use the toggles at the top of the module to turn on and off Monitoring for individual Cognos environments.

Adjust the Monitoring Frequency to meet your needs. The Monitoring Frequency is set to 10 minutes as a default.

In the event of an environment status change, a failure or otherwise, MetaManagerTM can perform one of three standards options including sending an Email, creating a Web Request, or running a custom Script.

To edit the details of any object, double click the item, or select the edit icon. To remove an action, click on the X icon, or select the object and hit the delete key. You can select multiple items using a shift+click or control+click to delete multiple items.
An action can be edited to be any type of action and can be enabled or disabled through a simple check box.

By default, new actions are set to be Enabled, and to Execute once for each environment failure.
By selecting the Execute on any status change checkbox, the action will be performed no only upon an environment failure, but on any change of the environment, including the change from a failed environment to a functioning environment.
By selecting the Execute once for all failures radio button, instead of a new action for each environment failure, MetaManagerTM will batch the actions together and include all failures during a monitoring period into one action.
The Execution Results tab provides a quick glance at the environment status over the last several monitoring periods. This tab can be configured to include the results from the Last Hour, Last 24 Hours, Last Week, Last Month, or All Data.

Additionally, results can be configured to include All Results, Successes only or Failures only, for one or all monitored Cognos environments.

The Service Console tab provides the ability to Reload Configuration, Run Monitoring Checks with the click of a button, and to Test the Actions set up on the Configuration tab. The Service Console tab also includes a step-by-step review of the monitoring service.
